@cryptodailyfeed
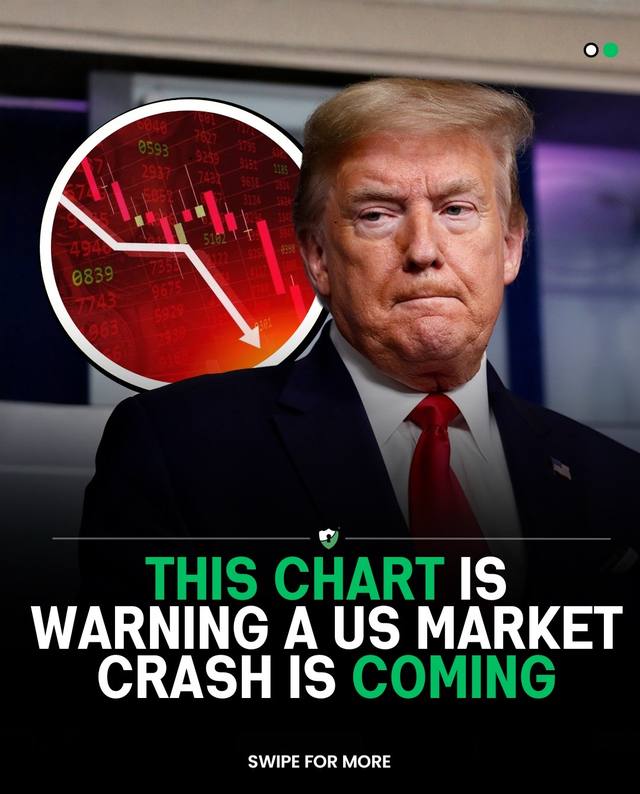
We now have 4 key reasons behind this warning. 1. Fractal Pattern Alignment (Dot-Com Comparison) A direct overlay of today’s market with the dot-com bubble shows a nearly identical structure. The timing of rallies, corrections, and current positioning closely match the late-stage phase seen before the 2000 crash. This suggests repeating investor behavior and late-cycle conditions. 2. Buffett Indicator (Market Cap to GDP) The ratio of total US market value to GDP is near record highs. This indicator measures how expensive the market is relative to the economy. Historically, extreme readings have preceded major corrections, indicating stocks may be significantly overvalued. 3. CAPE Ratio (Cyclically Adjusted Valuation) The CAPE ratio is approaching levels last seen during the dot-com bubble. This metric smooths earnings over time and shows that investors are paying far above historical averages for stocks, a typical sign of late-stage market cycles. 4. Consumer Confidence Index Consumer sentiment has dropped to low levels, often seen before economic slowdowns. This creates a disconnect between strong market performance and weakening economic confidence, which has historically been unsustainable. Together, these signals point to a market that may be stretched and increasingly fragile. This does not mean a crash is happening right now, but it suggests the market is in a late-stage cycle where risks are building. If current conditions continue, the probability of a major downturn increases, with late 2026 to early 2027 emerging as a likely period where pressure could materialize. Follow @cryptodailyfeed for Updates 🔥 #StockMarketCrash, #MarketWarning, #SmartMoney, #FinancialCrisis, #sp500
Open original ↗How to reproduce this format
More crypto hooks that worked
 TikTok breakdown×54 its author's norm
 X breakdown×11 its author's norm
 TikTok breakdown×11 its author's norm
 X breakdown×7.8 its author's norm